If simply put, shellcode is a piece of low-level code (in hex) carefully tailored to be directly interpreted by the CPU. The CPU executes instructions in the form of machine code, these instructions are typically referred to as opcodes or operation codes. Here are a couple popular instructions you'll often come across (1 per line):
55
8B EC
These instructions will be directly executed by the CPU, which will then perform two specific tasks:
55 push ebp
8B EC mov ebp, esp
The code on the right of the opcodes is the opcodes' corresponding assembly instructions. Assembly (or assembler) is a human readable representation of these opcodes. These two instructions are setting up a new stack frame, which you can equate to entering a new function in a high-level programming language like C/C++. So just think of shellcode as PIC (Position Independent Code) ready to hit the CPU. Shellcode may come in a few different flavors, here are some formats you might come across:
'\x55\x8B\xEC'
'38E0'
'0x52,0x57'
'%u4141%u8366'
You may find these payloads in office doc malware, portable executables, javascript, powershell scripts, etc...literally anywhere. Incident Responders often are intimidated by shellcode, which can appear daunting and complex. Hopefully the following techniques will assist in approaching shellcode analysis.
First things first, have to extract the shellcode. I see a lot of shellcode residing within powershell malware, so I grabbed a fairly straightforward sample to demonstrate. It can be found here: https://app.any.run/tasks/2bc9bd6f-6803-4ada-ac64-ebabadee9e3e
This malware is a .bat script that runs a powershell payload. We can see a large base64 string being concatenated and will focus on that.
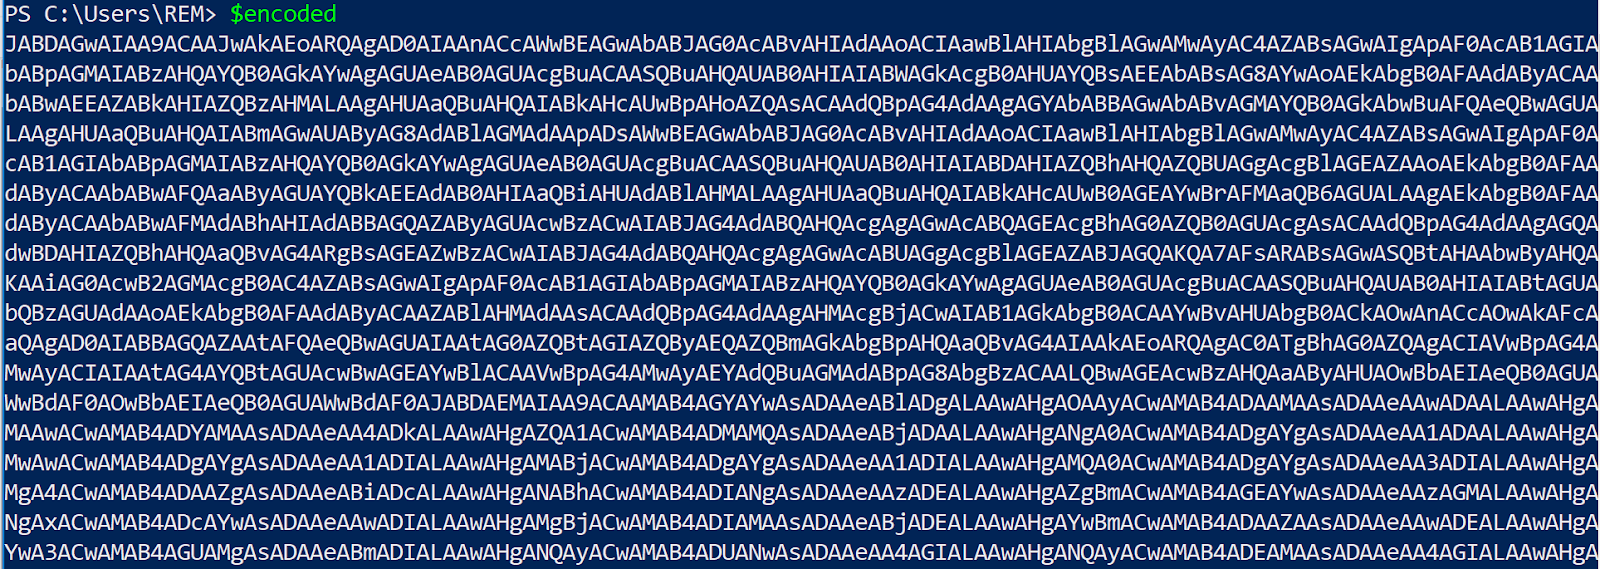
 We will use powershell to decode the base64. First by storing the results of the concatenation in a variable.
Command: $encoded = '<base64 string here>'
 Then we can check the value of the $encoded to ensure that the concatenation completed successfully.
 Next we convert the base64 to bytes.
Command: $bytes = [convert]::FromBase64String($encoded)
Then checking the value of $bytes.
 Finally, we can convert these bytes to a string. Notice the null bytes above, this is a unicode string.
Command: $decoded = [System.Text.Encoding]::Unicode.GetString($bytes)
 From here, I recommend copying this script into Notepad++ for a friendlier view. We can see the shellcode being stored into a variable $CC as a byte array (byte[]), which we will extract for further analysis. There are a couple different ways to dump this shellcode. My favorite is to do it in powershell via the 'WriteAllBytes' method from the .NET 'File' class. This method will create a new binary file comprised of the specified byte array.
Command(s):
[Byte[]]$CC = 0xfc,0xe8,etc..... # define variable containing shellcode (type is byte[])
[io.file]::WriteAllBytes('shellcode.bin',$CC) # write shellcode to file
cat shellcode.bin # check that bytes were written to file successfully
 Another option we have is to copy out the hex, paste it into a hex editor, and then save that to a file. First remove the formatting, so that all is left are hex bytes (remove '0x' and ',').
 Then paste this into a hex editor like HxD, save to file, and there ya go.
 Alright, we are finally ready to do some analysis. I recommend first triaging the shellcode with the very handy tool 'scdbg'. This is a shellcode emulator that will basically give you the API calls and arguments that a piece of shellcode calls. It has both a GUI and command line interface. The tool can also identify whether or not a file has shellcode in it, but keep in mind that if the shellcode is obfuscated it may not catch it. For the scdbg GUI, we will check FindSc and then click launch.
 A cmd.exe window will pop up and prompt you for either (int/reg) - which we will enter int. The results will then print to the console, showing a few API calls being made, all centered around a network socket. LoadLibrary will load the specified module in the calling process, and WSAStartUp will initialize the usage of the ws2_32.dll library (used for network sockets). WSASocket creates the socket itself, and connect will establish the connection to the specified socket.
 As I said before, scdbg also has a command line interface.
Command: scdbg /findsc /f shellcode.bin
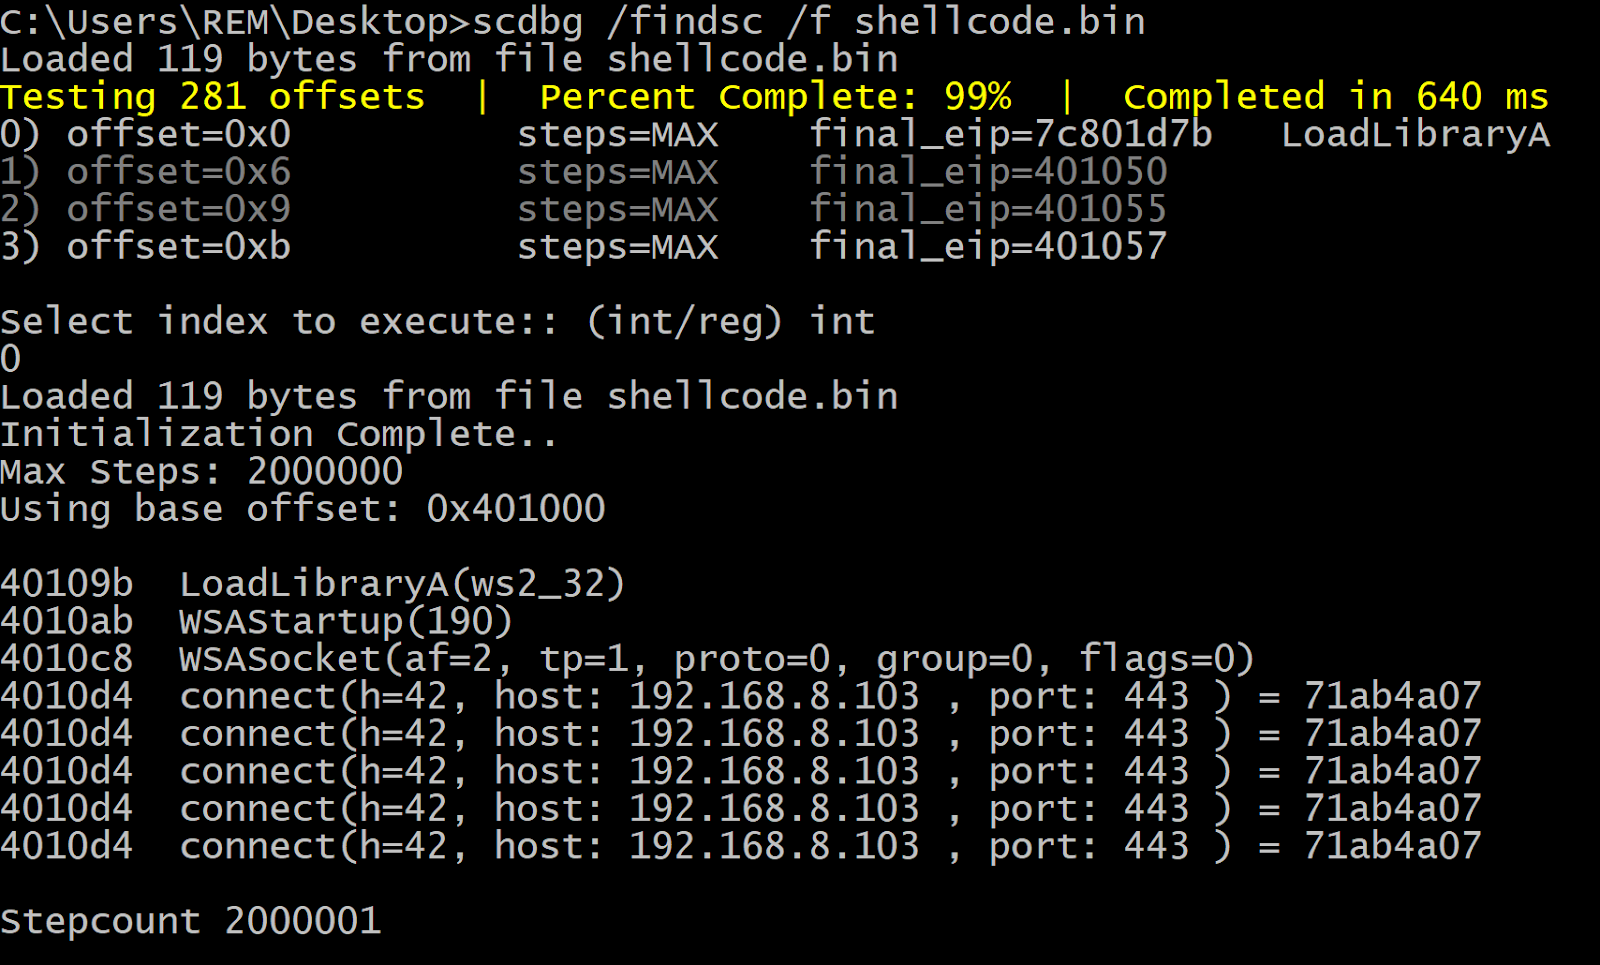 As you can see, scdbg has given us an idea of the purpose of the shellcode, as well as a network-based IOC (hardcoded IP). This may be enough analysis for a quick triage, maybe if responding to a breach or another sort of 'stop the bleeding' IR investigation.
The next technique will involve actually executing the shellcode while running system monitoring tools used for dynamic analysis. For this, we will need a host process to interpret and run the shellcode. One approach is to use shellcode2exe.py, which will create an executable out of the shellcode that can then be analyzed as you normally would an executable. This tool is native to REMnux, and works very well for most shellcode. However, some of the bigger pieces of shellcode that you may see within fileless malware (for example) may be too big for the tool.
Command: shellcode2exe.py shellcode.bin
 We can then proceed to do some dynamic analysis as we would for any other PE malware. I would recommend running Process Monitor, Process Hacker, RegShot, and Wireshark while executing the malware. When this malware executed, nothing interesting popped up in the system monitoring tools. All the process activity looks normal for loading a PE in Windows. Here we just see the necessary modules being loaded, including ws2_32.dll.
 Reviewing the PCAP, we can see the activity that scdbg found and confirm that it was correct.
 So far, these techniques have been more so for triage, now we can dig a little deeper. IDA does a pretty good job disassembling shellcode. Although I have seen it misinterpret opcodes on several occasions, especially relating to pointers to data structures (e.g. PEB or Process Environment Block).
When loading the shellcode into IDA, we can keep the first set of options default.
 The next option is dependent on whether or not the shellcode is 32-bit or 64-bit, in this case it is 32-bit. I have not come across a ton of 64-bit shellcode, but it is out there. It should be fairly easy to determine the architecture after seeing the disassembled output.
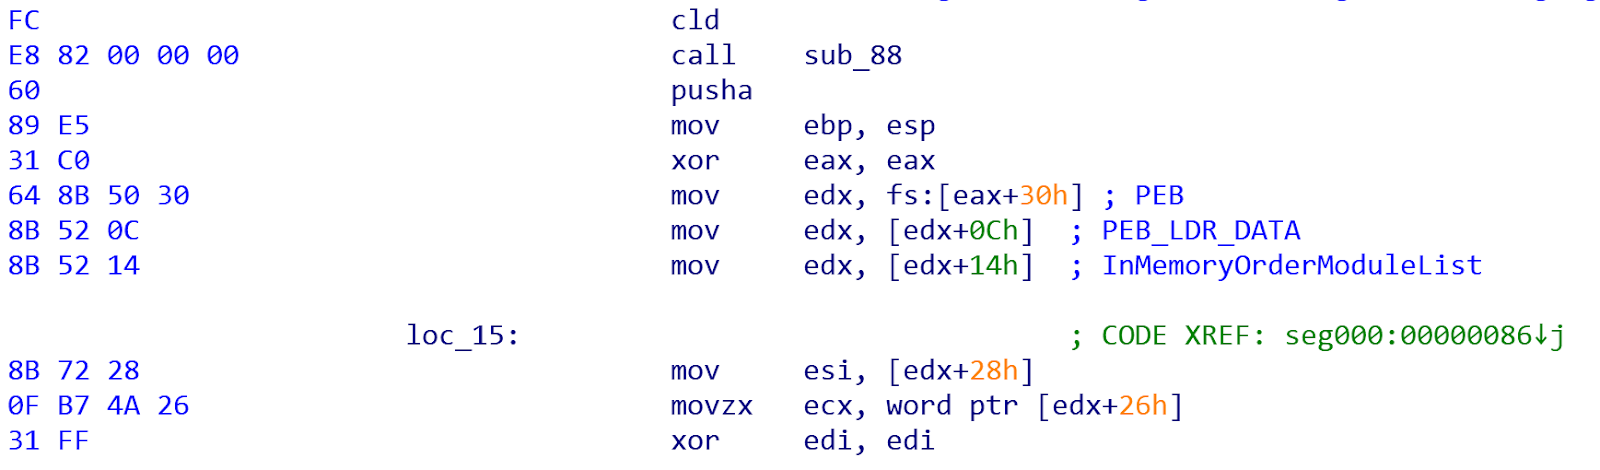
 After this window, IDA will disassemble the shellcode (hopefully correctly). In this case, IDA did not interpret the first block of shellcode as code, but rather as data. Then starting at sub_88, IDA sees it as code.
 Since we are confident that this is indeed code, we can convert the data by simply selecting it and pressing 'c'. Notice the second instruction, call sub_88. This instruction calls the function at offset 0x88 within the shellcode. A call instruction pushes the address of the next instruction (return address) onto the stack, and then jumps/transfers control flow to the address referenced by the call. Also, notice the reference to 'fs:[30]', this is a pointer to the PEB, which is how the shellcode will dynamically locate and load the imports it needs.
 If we scroll through the code a bit we can see a 'call ebp', with a few hex strings passed as parameters.
 Sometimes these hex strings decode to ASCII, maybe as references to the file system, running processes, API calls, modules, etc...We can translate the hex to ASCII through selecting the string and typing 'r'.
 And there we see the ws2_32.dll library being passed to the function at ebp. The string is backwards due to x86 being little endian. So IDA is great for picking through the code, and getting a feel for control flow. Perhaps the debugger is an even more useful tool for shellcode analysis. There are a couple different ways to load shellcode into your debugger of choice.
We can simply load the executable we generated with shellcode2exe.py into x32dbg and get right into debugging.
 Another useful method for debugging shellcode is to use jmp2it. This is especially useful for shellcode too big for shellcode2exe.py.
Command: jmp2it shellcode.bin 0x0 pause
The 0x0 is for the offset in the file where the shellcode begins, the pause option is to tell jmp2it to pause before execution of the shellcode so that we can attach a debugger to the process.
 As the directions say, attach to the process with your debugger (in x32dbg --- File -> Attach -> jmp2it), click go/run, and then click pause after a couple seconds. As you can see below, jmp2it has created an interesting instruction preceding a call to the shellcode (edi). This instruction is a jump to itself or EB FE, which is a jump back two bytes. So this creates an infinite loop because it is jumping back two bytes back to the jump itself.
 To get into the shellcode, we will patch this tiny infinite loop with a 'nop' or 'no operation' instruction (0x90). This opcode simply means go to the next instruction. To patch this, select the infinite loop, and click the space bar. Then type in 'nop' and check the 'Fill with NOP's' box, and click ok.
 Once this is patched, step into the call to edi, which will bring us to the shellcode. Here is the patched code.
 And after we step in, we see some familiar code.
 We would then proceed to reversing the code as you would normally debug a PE. Here are a couple tips for debugging shellcode:
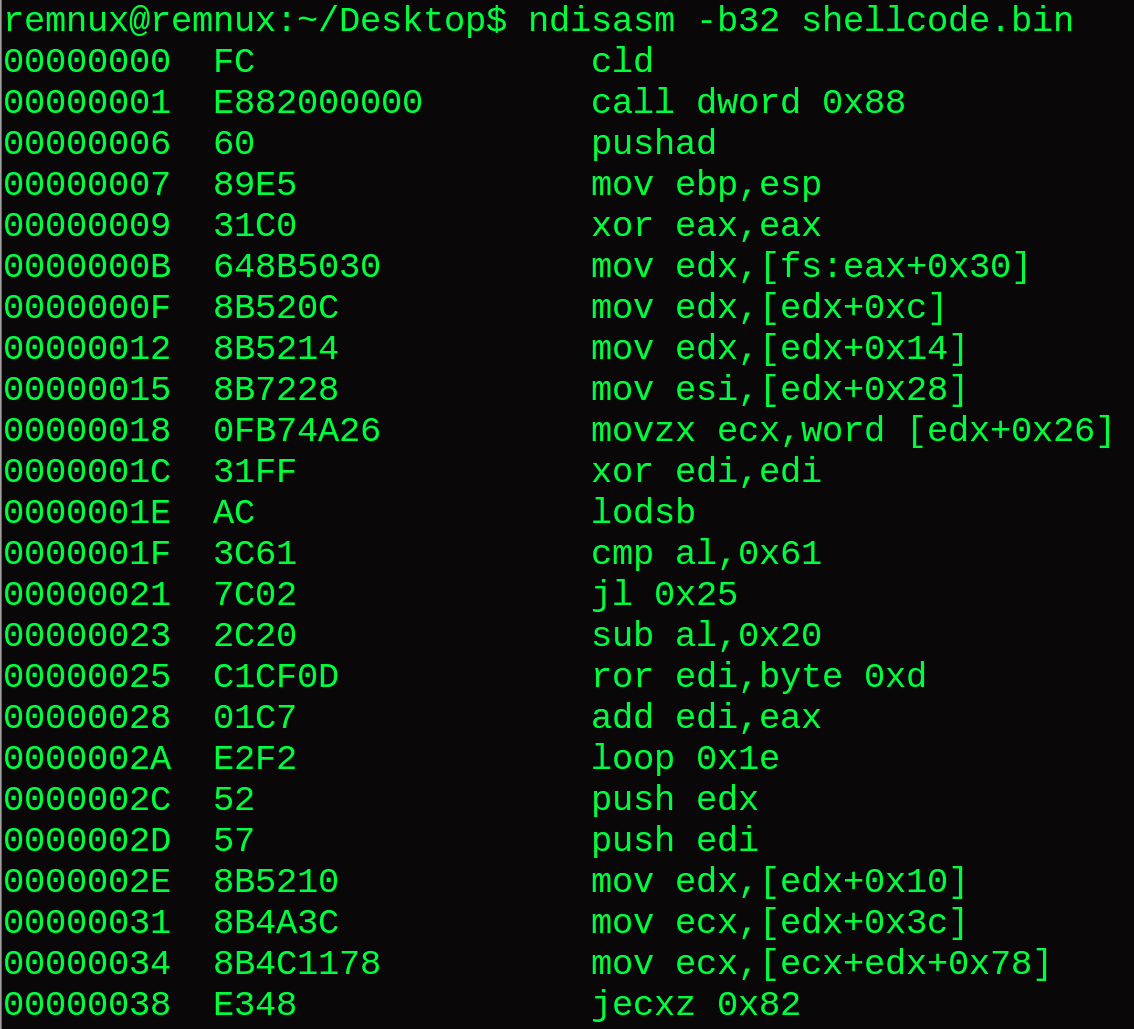
Lastly, here are a couple IDA alternatives - which I have never had problems with as far as mishaps in interpreting instructions. NDISASM is a very useful dissembler built into REMnux.
Command: ndisasm -b32 shellcode.bin
 Another alternative is the powerful disassembler and debugger radare2, which is also built into REMnux.
Command(s):
r2 shellcode.bin # start the radare2 console
aaa # analyze all
pdf # print disassembly of function
 Happy REversing!
'\x55\x8B\xEC'
'38E0'
'0x52,0x57'
'%u4141%u8366'
You may find these payloads in office doc malware, portable executables, javascript, powershell scripts, etc...literally anywhere. Incident Responders often are intimidated by shellcode, which can appear daunting and complex. Hopefully the following techniques will assist in approaching shellcode analysis.
First things first, have to extract the shellcode. I see a lot of shellcode residing within powershell malware, so I grabbed a fairly straightforward sample to demonstrate. It can be found here: https://app.any.run/tasks/2bc9bd6f-6803-4ada-ac64-ebabadee9e3e
This malware is a .bat script that runs a powershell payload. We can see a large base64 string being concatenated and will focus on that.
Command: $encoded = '<base64 string here>'
Command: $bytes = [convert]::FromBase64String($encoded)
Then checking the value of $bytes.
Command: $decoded = [System.Text.Encoding]::Unicode.GetString($bytes)
Command(s):
[Byte[]]$CC = 0xfc,0xe8,etc..... # define variable containing shellcode (type is byte[])
[io.file]::WriteAllBytes('shellcode.bin',$CC) # write shellcode to file
cat shellcode.bin # check that bytes were written to file successfully
Alright, we are finally ready to do some analysis. I recommend first triaging the shellcode with the very handy tool 'scdbg'. This is a shellcode emulator that will basically give you the API calls and arguments that a piece of shellcode calls. It has both a GUI and command line interface. The tool can also identify whether or not a file has shellcode in it, but keep in mind that if the shellcode is obfuscated it may not catch it. For the scdbg GUI, we will check FindSc and then click launch.Command: scdbg /findsc /f shellcode.bin
The next technique will involve actually executing the shellcode while running system monitoring tools used for dynamic analysis. For this, we will need a host process to interpret and run the shellcode. One approach is to use shellcode2exe.py, which will create an executable out of the shellcode that can then be analyzed as you normally would an executable. This tool is native to REMnux, and works very well for most shellcode. However, some of the bigger pieces of shellcode that you may see within fileless malware (for example) may be too big for the tool.
Command: shellcode2exe.py shellcode.bin
When loading the shellcode into IDA, we can keep the first set of options default.
We can simply load the executable we generated with shellcode2exe.py into x32dbg and get right into debugging.
Command: jmp2it shellcode.bin 0x0 pause
The 0x0 is for the offset in the file where the shellcode begins, the pause option is to tell jmp2it to pause before execution of the shellcode so that we can attach a debugger to the process.
- Set breakpoints on all calls - all of these are important and shellcode is small enough where it shouldn't be too noisy
- Set breakpoints on LoadLibrary and GetProcAddress to see what imports are resolved dynamically
- Set breakpoints on API calls that are resolved dynamically
- Some shellcode (poweliks, kovter) takes in its address as an argument. In this case, simply patch the infinite loop with 'push edi' to give the shellcode its address in memory
Lastly, here are a couple IDA alternatives - which I have never had problems with as far as mishaps in interpreting instructions. NDISASM is a very useful dissembler built into REMnux.
Command: ndisasm -b32 shellcode.bin
Command(s):
r2 shellcode.bin # start the radare2 console
aaa # analyze all
pdf # print disassembly of function
Good one :) do u have youtube channel?
ReplyDeleteAnalyzing Windows Shellcode - Triage, Disassemble, Debug. >>>>> Download Now
Delete>>>>> Download Full
Analyzing Windows Shellcode - Triage, Disassemble, Debug. >>>>> Download LINK
>>>>> Download Now
Analyzing Windows Shellcode - Triage, Disassemble, Debug. >>>>> Download Full
>>>>> Download LINK XI
Thank you for posting this very helpful walk-through.
ReplyDeleteNice blog, very informative content.Thanks for sharing, waiting for the next update…
ReplyDeletepython learning tutorial
python full tutorial
Great post. keep sharing such a worthy information
ReplyDeleteRPA Training in Chennai
RPA Training Online
RPA Training In Bangalore
Really nice blog. thanks for sharing
ReplyDeletebest java institute in chennai
best java training institute in chennai
Analyzing Windows Shellcode - Triage, Disassemble, Debug. >>>>> Download Now
ReplyDelete>>>>> Download Full
Analyzing Windows Shellcode - Triage, Disassemble, Debug. >>>>> Download LINK
>>>>> Download Now
Analyzing Windows Shellcode - Triage, Disassemble, Debug. >>>>> Download Full
>>>>> Download LINK Vg
Awesome!
ReplyDelete